
Most of the leaders with whom I talk understand the importance of data. They will tell you that to be a good leader you have to be comfortable with and knowledgeable about the data that drives your organization. However, many leaders are not providing leadership when it comes to using data and information.
Take a look through your most recent presentation. What are you communicating? Do you tend to use tables full of data? Do you have charts and graphs quantifying key business trends or results? Do you use lists to show how various areas are performing, perhaps sorted high to low?
If you are like many leaders, that type of information is probably a staple in your presentations. If it is, then you are not leading. Anyone, inside or outside of your organization, with access to a calculator, spreadsheet, or statistics program could provide that type of information. You need to take it up a notch.
I once was listening to a presentation given by a high performing manager and senior leader in the organization. The presentation had a set of slides with results from a leadership survey. Each slide showed the results for a give region with the average score for each questions. The questions were sorted from lowest score to highest score. Each slide also had a box in the upper right corner titled Key Insights. The “key insights” were a list of the three lowest scoring questions proceeded by the phrase, “The three lowest scoring items are . . .”
Were those really insights? You don’t even have to understand the business to generate those slides. As a leader your role is to add context and perspective to generate insights. So, how do you create meaning from data?
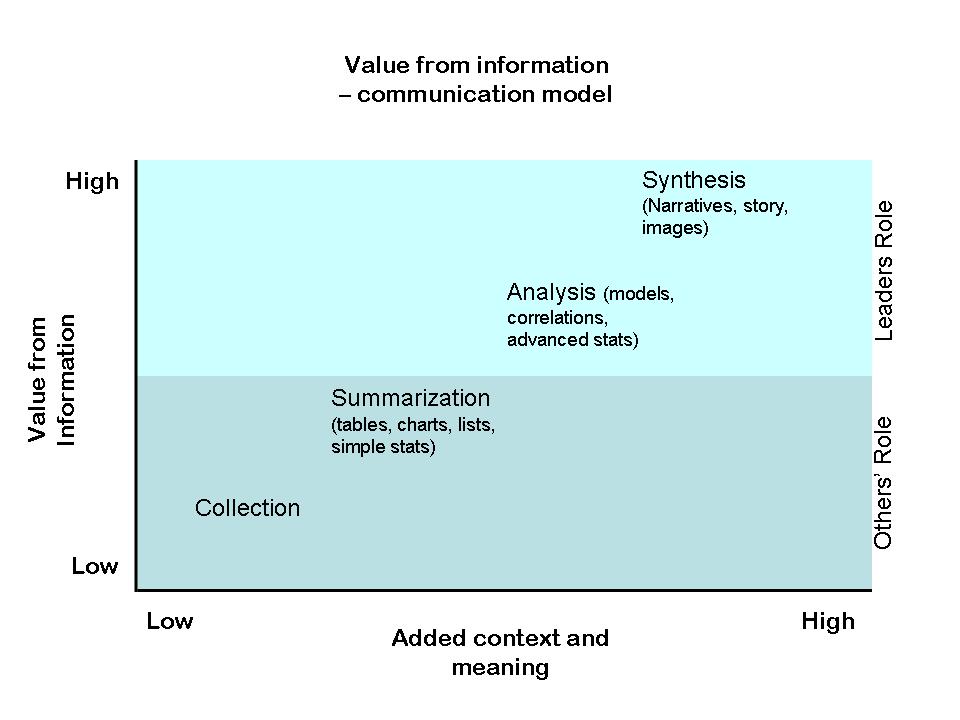
 There are four levels at which you can create value through information: Collection, Summarization, Analysis, and Synthesis. This general model isn’t new. In fact you might remember it as the research process that you learned in college. Instead of just looking at this as a process, I like to look at it relative to how you use and communicate information.
 As a leader, you have a role at each level. However, most of your time and discussions should be near the top at the analysis and synthesis levels.
Collection
Collection is the most basic level of generating value from information. I’ve worked in many organizations that couldn’t answer basic questions about the business. These organizations had people with strong analytical skills and had tools for analyzing data. However, they didn’t have the data. In some cases it didn’t exist – no one had thought to collect it. More often, the data was housed in multiple places, used different methods of organization and indexing or didn’t capture the information in the right way. Your role at this level is to use your insight and experience to ensure that the right data is being collected.
The key to good data collection is working backward from your end point. What business decision do you need to make? What type of analysis is required to make that decision? What data do you need to perform that analysis? Where does that data/information reside? Finally, what is the best way to get it? This might sound obvious but it doesn’t always happen. Instead, a leader will provide a general question and then jump right to data collection. For example, a leader might say, “I wonder what our customers think of our product line. Let’s do a survey.” Inevitably, this survey will ask a lot of questions that are not necessary (probably driving down the response rate) and will miss a couple of key points or distinctions that will be needed later.
You understand the business. You know what decisions need to be made. Your job is to ensure that your organization is collecting the right kind of data to answer those questions.
Getting data into a single place (or making it so it could be accessed as if it were in a single place) enables the organization to move up the value curve to find meaning and value in their data.
Summarization
Summarization is the next level in creating value from information. It is the level which with most of us is familiar. It is the level at which most leaders stop when working with information.
Summarizing data enables you to get a simple picture of what is happening. Averages, tables and charts enable you to compare entities against each other or identify where problems might exist. For example, a summary of sales data might tell you that region B,C, and G have the lowest sales in the country. That’s helpful information. It can help drive decisions about how to allocate resources and take actions in your business.
However, summarizing data just provides facts. Facts might show you what is happening, but they generally don’t tell you why it is happening. Anyone with access to data can generate facts. Your job is to use those facts to generate meaning and insight.
Analysis
Analysis increases the value of information by shifting your understanding from “what” is happening to “why” it is happening. I often tell people that there are no insights in lists. That is because lists, by themselves, don’t show relationships. Analysis allows you to find relationships. Relationships provide insights.
When you are working at an analytical level, you are dealing correlations, patterns, relationships, and causal and effect. All of these require that you combine multiple sets of facts. This is where you can begin to add value.Think back to the simple list of sales by region. You know that B,C, and G had the lowest sales but are you prepared to take action? Facts may prompt action, but they don’t direct it.
Do you understand they key drivers of revenue and expense for your business? Do you know the key actions and processes that your organization uses to conduct business? What are your competitors up to? How their actions might be impacting you.
By using your understanding of the business you provide direction for the analysis and keep it focused. That is where you add value in this part of the process.
In the sales example, what do region B,C and G have in common? Perhaps they have the same regional manager. Maybe they are the three regions where your competitor just launched an aggressive marketing campaign. It could be that B,C, and G all represent a demographic which is not (or no longer) interested in your product. Perhaps you use a different sales incentive program in those regions.
This type of work can’t be done by just anyone with a spreadsheet. It requires knowledge of your business, industry, and market. It is at this level where you start to draw significant value from data and information. It is at this level, that you as leader can make a unique contribution.
While you might want to be a bit more involved at this level (than at the previous two), you still shouldn’t spend a lot of time here. Use analysts or other front line staff to crunch the data for you. Your role at this level is to use your understanding of your business to develop hypotheses that should be tested in order to explain the data.
Synthesis
Once you find the insights, the most important contribution you can make is to help people understand what they mean. When you synthesize data, you create a story about your business. Synthesized information is less about the numbers and more about the meaning of those numbers.
This is where you can create the most value as a leader. This is where you should be spending most of your time and effort.
Synthesis involves combining data from multiple sources and analysis with your broader understanding of the current business context and direction. How can you apply your understanding of the company’s strategic direction to the information you are hearing? Can you incorporate the latest market research or competitive analysis to provide context for the findings? This is what synthesis is about.
Back to the sales example; we know that sales are poor in three regions. We also know a little bit about why those sales are poor. By combing that information with your broader understanding, you are ready to create a story and provide meaning to the current situation.
Does it matter that sales are falling in regions B,C, and G? Do we care about the demographic that is not buying our product? How does the drop in sales in B,C, and G reflect our business at large? Is it a foreshadowing of our future or is it a reflection of our past? As a leader, your job is to help people make sense of information. For a more in-depth perspective on the importance of story and meaning, I would recommend Daniel Pink’s book, A Whole New Mind.
Conclusion
Your people, your management, your shareholders, and your customers are drawn to the story that you can tell about your business. Data and numbers play and important role in those stories. However the greatest value you provide is not from the numbers themselves but rather in helping others understand what those numbers are saying.
Imagine if the President gave a State of the Union Address that was purely facts and figures about the nation. Look at where the graphs and tables are positioned in a company’s annual report. Think of the leaders who inspire the greatest action – where do they focus?
Look back at your presentations. Are you just summarizing facts? How many of your points represent your knowledge or the business? Take a bold step. Move all the charts, tables, and graphs to the appendix. Then, tell the story of your business and what you are recommending for its future. Better yet, start moving all of your thinking, conversation, and time to analysis and synthesis.

Brad/Others- Your points about providing the most value as a leader through analysis and synthesis makes perfect sense…but I don’t find it an ability that I have developed although I am knowledgable in my field. What suggestions do you have to build strength in this capacity?
Just a quick note to say thanks for this tip. I was recently asked to present to the firm’s managing board and in short order had all the data to fill hours of discussion. Resisting the urge, I looked for the story instead of the displaying facts and figures. The message was compelling, the story was coherent, and I received many compliments on the simple messages within. Thanks the insight and guidance.