
It’s been twenty years since I hastily scribbled the Value through information model on a piece of paper.
At the time, I created the model simply as a coaching tool for my team. Their presentations were heavy on information and light on analysis and interpretation.
Little did I know that the model would increase so much in its appeal and applicability. Data and information have become easier to access and more prevalent in our lives. Taming them has become an essential skill for everyone in an organization.
For twenty years, the Value through Information model has been helping people turn data into action.
In honor of its twentieth birthday, I am reposting a slightly updated version of my article, Leading with Data which introduces the Value through Information model.
————————-
Most of the leaders with whom I talk understand the importance of data. They will tell you that to be a good leader you have to be comfortable with and knowledgeable about the data that drives your organization.
However, many leaders are not providing leadership when it comes to using data and information. They are focused in the wrong place.
The value of data is in decisions and actions. If you aren’t focusing there, you are not leading.
Take a look through your most recent presentation. What are you communicating?
Do you tend to use tables full of data? Do you have charts and graphs quantifying key business trends or results? Do you use lists to show how various areas are performing, perhaps sorted high to low?
If you are like many leaders, that type of information is probably a staple in your presentations. If it is, then you are not leading.
Anyone, inside or outside of your organization, with access to a calculator, spreadsheet, or statistics program could provide that type of information. You need to take it up a notch.
A leader’s job is to generate meaning by providing context and perspective to data.
I once was listening to a presentation given by a high performing manager and senior leader in an organization. The presentation had a set of slides with results from a leadership survey.
Each slide showed the results for a give region with the average score for each question. The questions were sorted from lowest score to highest score.
Each slide also had a box in the upper right corner titled Key Insights. The “key insights” were a list of the three lowest scoring questions proceeded by the phrase, “The three lowest scoring items are . . .”
Were those insights? You don’t even have to understand the business to generate those. They are just facts.
So, how do you create meaning from data?
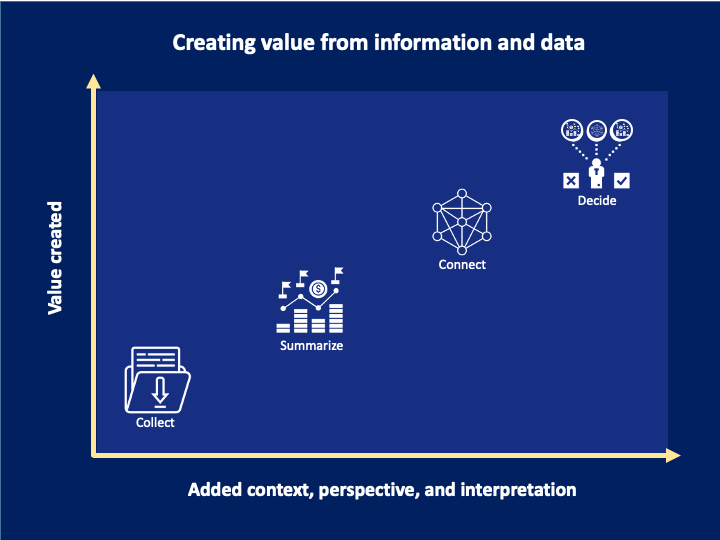
There are four successive levels at which value gets created through information: Collecting, Summarizing, Connecting, and Deciding[1].
Each level provides significantly more value than the last. As a leader, you have a role at each level. However, most of your focus, time, and discussions should be at the connecting and deciding levels.
Collecting
Collecting is the most basic level of generating value from information.
I’ve worked in many organizations that couldn’t answer basic questions about the business. These organizations had people with strong analytical skills and had tools for analyzing data. However, they didn’t have the data. In some cases it didn’t exist. No one had thought to collect it. More often, the data was housed in multiple places, used different methods of organization and indexing or didn’t capture the information in the right way.
Your role at this level is to use your insight and experience to ensure that the right data is being collected.
The key to good data collection is working backward from your end point.
What business decision do you need to make? What type of analysis is required to make that decision? What data do you need to perform that analysis? Where does that data/information reside? Finally, what is the best way to get it?
This might sound obvious but it doesn’t always happen. Instead, a leader will provide a general question and then jump right to data collection.
For example, a leader might say, “I wonder what our customers think of our product line. Let’s do a survey.”
Without guidance and clarity, the survey will likely have a lot of questions that are not necessary (probably driving down the response rate) and will miss a couple of key points or distinctions that will be needed later.
Your job is to help frame the data. What specifically do you want to know from your customers? What aspects of the product line do you want to explore? What hypotheses do you have about customer beliefs and behaviors? Let your team know so that the survey and data can be simple, clear, and focused.
You understand the business. You know what decisions need to be made. Your job is to ensure that your organization is collecting the right kind of data to answer those questions.
Getting data into a single place (or making it so it could be accessed as if it were in a single place) enables the organization to move up the value curve to find meaning and value in their data.
Summarizing
Summarizing is the next level in creating value from information. Summarizing describe your data.
It is the level which with most of us is familiar. It is also the level at which most presentations and discussions take place. Unfortunately, it’s not the right level to drive effective and efficient decision-making. You can’t start making decisions until you get to the “connecting” phase of the model.
Summarizing rolls data up into high level metrics and graphs, and visualizations. It provides a simple picture of what is happening within that discrete data set.
For example, a summary of sales data might give you the average sales across regions. It might tell you that region B,C, and G have the lowest sales in the country. Or, it might provide a heat map of the entire country showing areas of higher and lower sales.
That’s helpful information and can be an input to decision-making. However, summarizing data just provides facts. Facts might show you what is happening, but they generally don’t tell you why it is happening.
Anyone with access to data can generate facts. They don’t even have to understand your business. As a leader, if this is where your contribution stops, you are not adding the value that is needed from you.
At this level your role is to help your analysts understand how to organize the data summaries.
For example, in one organization revenue was reported by region. There were two levels of breakdown: 8 regions which were divided into 30 sub-regions.
Over time, two sub-regions started to dominate revenue. They accounted for 20% of the revenue of the entire company.
Reporting by region became ineffective. The two most important revenue producers were buried two layers down in the report. On the other hand, a region which accounted for less than 4% of total revenue was still reported at the main level. And, that region was still be broken down into its 8 sub-regions. That was way more granularity than was needed for such a low revenue producing area of the organization.
The organization’s CEO instructed the analytics team to revise and reorganize the report.
The first level of reporting was organized by contribution to revenue. It divided the organization into 8 “buckets” of revenue. As a result, some of the previous sub-regions were now listed at the main level. And, several of the lower producing regions wound up grouped together into an “Other Region” bucket. There was no need to look at them individually. Their contribution to revenue didn’t warrant that level of attention. Finally, the CEO had each revenue category further divided by service line.
The new report was much more effective. It put the right level of focus on each area. It also provided better insight into where the revenue was coming from by using the service line breakdown.
As a leader, your job is to ensure that information is being presented in ways that best direct people’s attention to the right things.
Collecting and summarizing provide value. However, the value is very basic. These two layers don’t require much understanding of your business. Executing them can be outsourced. If this is where you are focusing your time, you are missing an opportunity to add value to your organization.
As a leader, your focus should be at the connecting and, most importantly, deciding level of the model.
Connecting
Connecting increases the value of information by shifting your understanding from “what” is happening to “why” it is happening.
There are few insights in lists. That is because lists, by themselves, don’t show relationships. You can’t make a decision without finding a relationship.
When you are working at the connecting level, you are dealing correlations, patterns, relationships, and cause and effect. All of these require that you combine multiple sets of facts and information.
Think back to the simple list of sales by region. You know that B,C, and G had the lowest sales but are you prepared to take action? Facts may prompt action, but they don’t direct it.
Your role in this part of the process is to use your understanding of the business you provide direction on where to look for connections.
In the sales example, do regions B,C and G have anything in common? Perhaps they have the same regional manager. Maybe they are the three regions where your competitor just launched an aggressive marketing campaign. It could be that B,C, and G all represent a demographic which is not (or no longer) interested in your product. Perhaps you use a different sales incentive program in those regions. Finding the pattern will help you drive action.
This type of work can’t be done by just anyone with a spreadsheet. It requires knowledge of your business, industry, and market. It is at this level where you start to draw significant value from data and information. It is at this level, that you as leader can make a unique contribution.
Do you understand they key drivers of revenue and expense for your business? Do you know the key actions and processes that your organization uses to conduct business? Do you know what are your competitors up to? Do you understand how their actions might be impacting you?
While you might want to be a bit more involved at this level (than at the previous two), you still shouldn’t spend a lot of time here. Use analysts or other front line staff to crunch the data for you. Use your understanding of your business to develop hypotheses and questions that should be tested in order to understand the data.
Deciding
Once you find the insights, the most important contribution you can make is to help people understand what the data means to the organization and what needs to be done as a result of it.
The value of data is decisions and actions. If you aren’t getting to those, you aren’t creating value.
At the deciding level, you create a story about your business. Your presentation and discussions are less about the numbers and more about the meaning of those numbers.
As a leader, your job is to bring context to the data and analysis to create meaning. This is where you can create the most value.
Deciding requires synthesizing data from multiple sources and analyses with your broader understanding of current business context.
Back to the sales example. We know that sales are poor in three regions. We also know a little bit about why those sales are poor. By combing that information with your broader understanding, you are ready to create a story and figure out how to move forward.
Does it matter that sales are falling in regions B,C, and G? Maybe your strategic plan is to exit those markets anyway? Do we care about the demographic that is not buying our product? Maybe they were never your primary demographic in the first place or maybe they are critical to it. The answer to that question could drive very different decisions. How does the drop in sales in B,C, and G reflect our business at large? Is it a foreshadowing of our future or is it a reflection of our past?
Make sure you are getting the most value from your data
Your people, your management, your shareholders, and your customers are drawn to the story that you can tell about your business.
Data and numbers play and important role in those stories.
However the greatest value you provide is not from the numbers themselves but rather in helping others understand what those numbers are saying.
Look back at your presentations. Are you just summarizing facts? How many of your points reflect your knowledge or the business? Are you just passing along information that others provided to you?
Take a bold step. Move all the charts, tables, and graphs to the appendix. Then, tell the story of your business and what you are recommending for its future. Better yet, start moving all of your thinking, conversation, and time to analysis and synthesis.
Brad Kolar is an executive consultant, author, and speaker with Avail Advisors. Avail helps leaders simplify their problems, decisions, data, and communication. Contact Brad at brad.kolar@availadvisors.com.
[1] The original model used the labels Collecting, Summarizing, Analyzing, and Synthesizing.
